pingdom stats to graphite from the command line
so i have been doing some work with our internal monitoring systems the last couple of days and wanted a way to pull pingdom stats into our graphite server using only a couple of bash commands or just put it together into a little shell script.
after going through the pingdom api documentation, i was able to pull some curl commands that we used to poll pingdom then send the output to graphite.
first things first, you will need to have an account with pingdom, which will also give you the needed username and password, and an api key.
if you have that stuff already, we next need to get the id number of the check that you want to start putting in graphite. this can be accomplished in one of two ways:
from the pingdom dashboard: go to dashboard, select “up”, then click either the uptime or response icon. you will get the id of that check in the url in the form of:
https://my.pingdom.com/reports/uptime#check=XXXXXX&daterange=30days or https://my.pingdom.com/reports/responsetime#check=XXXXXX&daterange=30days where XXXXXX is the id (check number) of the check that you want to start plotting.
the other method to get your id (check number): if you already have your api key & username / password, we can just pass a curl command (with some python) as documented in the api documentation like so :
curl --silent --header "App-Key: api_key" -u "username:password" https://api.pingdom.com/api/2.0/checks | python -mjson.tool
the reason we pass the python -mjson.tool command after is to format the output. since it outputs unformatted json, its just easier to read if its formatted. with this output, just grep the line that reads “id”, that is your check number.
now to the juicy bits: how to extract data.
one thing i learned from polling pingdom data, is that it pings your configured server (url) every nine minutes, so even if you pull your data every x amount of seconds or minutes, it will only have an accuracy of 9 minutes, so we dont have to worry about too much precision of the data polled. this is article is more in line with just getting the data out.
now that we have the api key, username / password, & id (check id), we need to see what probes are our checks actually using. that can be accomplished with this line:
curl --silent --header "App-Key: api_key" -u "username:password" https://api.pingdom.com/api/2.0/results/XXXXXX | python -mjson.tool which should give you something similar to this :
{
    "activeprobes": [
        64,
        76,
        77,
        78,
        79,
        80,
        81,
        84,
        85,
        86
    ],
    "results": [
        {
            "probeid": 80,
            "responsetime": 842,
            "status": "up",
            "statusdesc": "OK",
            "statusdesclong": "OK",
            "time": 1374173361
        },
i shortened this since all we need is the “activeprobes” section
now that we have the list of the probes that are being used, we can further process our commands to get only the response time from that particular probe and id like so:
curl --silent --header "App-Key: api_key" -u "username:password" https://api.pingdom.com/api/2.0/results/XXXXXX\?limit=1\&probes=YYYYYY | python -mjson.tool | awk '/time/ {gsub(",",""); print}'where YYYYYY is one of the active probes we gathered above
the output from that curl command should look like:
            "responsetime": 47
            "time": 1374173608
you will notice that we are passing “limit=1” into our curl command, what that does is just limits the output to only one check, that check being the latest one.
another thing to note, the responsetime is given to us in milliseconds, so format your output accordingly to make more sense, or keep it as is, thats up to you.
now with the “responsetime” and “time” gathered, we can pass that information to graphite using netcat like so:
echo "name_or_identifier responsetime time" | nc graphite_server graphite_port
a breakdown of that command:
echo – pretty straight forward what echo is
name_or_identifier – this is what this check will be identified as in graphite
responsetime – this is the value that was gathered above. in this case “47”
time – this is the value that was gathered above. in this case “1374173608”
nc – netcat
graphite_server – this is the url / ip of your graphite server
graphite_port – this is the port that accepts graphite checks.
with some work, you should get graphs similar to this:
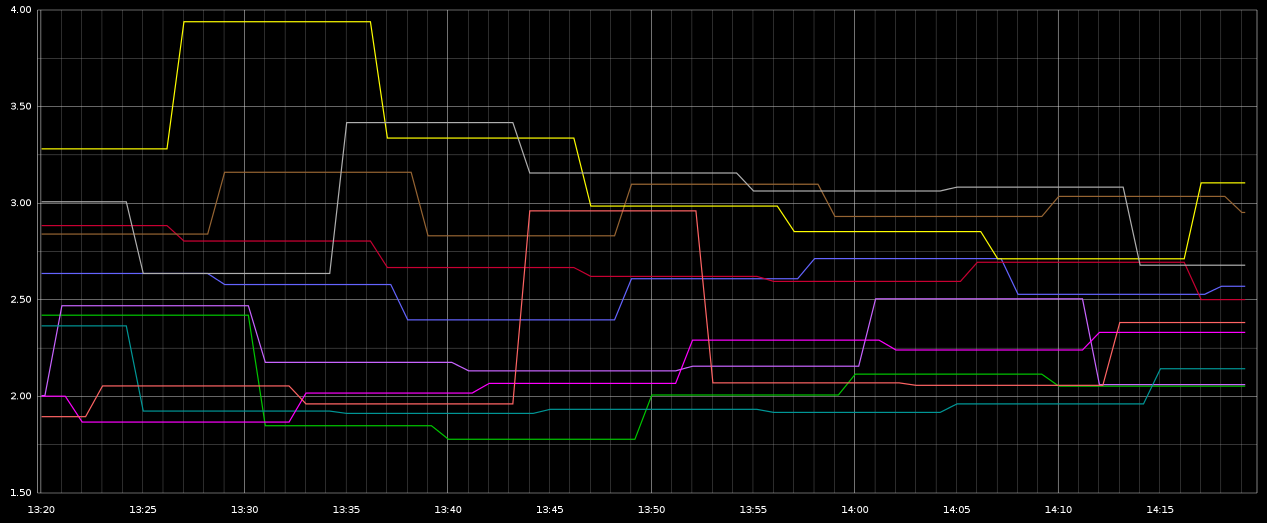
click to enlarge
i will be posting some scripts that i have written to use in house for multiple ids / probeids which are fully automated.
Seen this?
https://github.com/lewg/pingdom-to-graphite
Thanks for the advice. Have you ever worked with Anturis, a monitoring tool? What can you tell about it?
cant say that i have worked with it. i try to only work with open source / free(ish) tools, but i am taking a look.
Okay, I have a oneliner which is producing graphs via the above method but the graph has only a single item graphed, i.e. it doesn’t overlay all the pingdom individual measurements as in the above example graph. Anyone? What did you do to get graphite to overlay multiple related graphs in one physical box? Thanks!
how are you passing the data to graphite ?